Leipziger Stadtwerke develops dashboard for a virtual power station
Energy cycles are invisible – anyone who wants to control them needs a suitable user interface. This is all the more important because the systems are being restructured as the energy transition takes place – from a clear producer-consumer role distribution to dynamic structures in which many citizens can be active in different roles. Leipziger Stadtwerke has already recognised the need for suitable visualisations in the SPARCS work package “Virtual Power Plant”. With the dashboard developed in response, they are now also making data from other SPARCS work packages easier to view and control.
The starting point of the dashboard was the showcase created by the SPARCS project group of Leipziger Stadtwerke for the work package “Virtual Power Plant”. A highly technical-abstract topic by its very nature, which is why the city of Leipzig wanted an illustration here to make the data and structures accessible to non-technicians.
The dashboard now presents this and other demo cases from the SPARCS sub-project, which is managed by Leipziger Stadtwerke, for the development of virtual energy types, which can be controlled through a tile on the start screen of the dashboard. The following showcases are represented among others:
- The “smart socket” case: The socket with digital, remote-readable consumption data acquisition is intended to encourage its users, among other things, to temporarily reduce their power consumption on request of the municipal utilities or to postpone it.
- The intelligent charging management system for the electric vehicle fleet of Leipziger Stadtwerke works similarly: here, the loading operations of connected vehicles can be interrupted if required.
- The “cotton mill” case, where a live energy trade is simulated.
- The simulated integration of the “BMW storage farm” into the virtual power plant.
- In addition, the dashboard visualises the live data as well as time-limited predictions for the electricity production of over 40 PV systems on the buildings of Leipziger Wohnungs- und Baugesellschaft mbH (LWB).
- The “urban cockpit” offers important information plus: here, the measurement data of the weather, traffic and air sensors in the city area of Leipzig converge in real-time. With the help of this live inventory, action needs can be identified more quickly and specifically so that the energy and transport networks can be controlled accordingly in a timely manner.
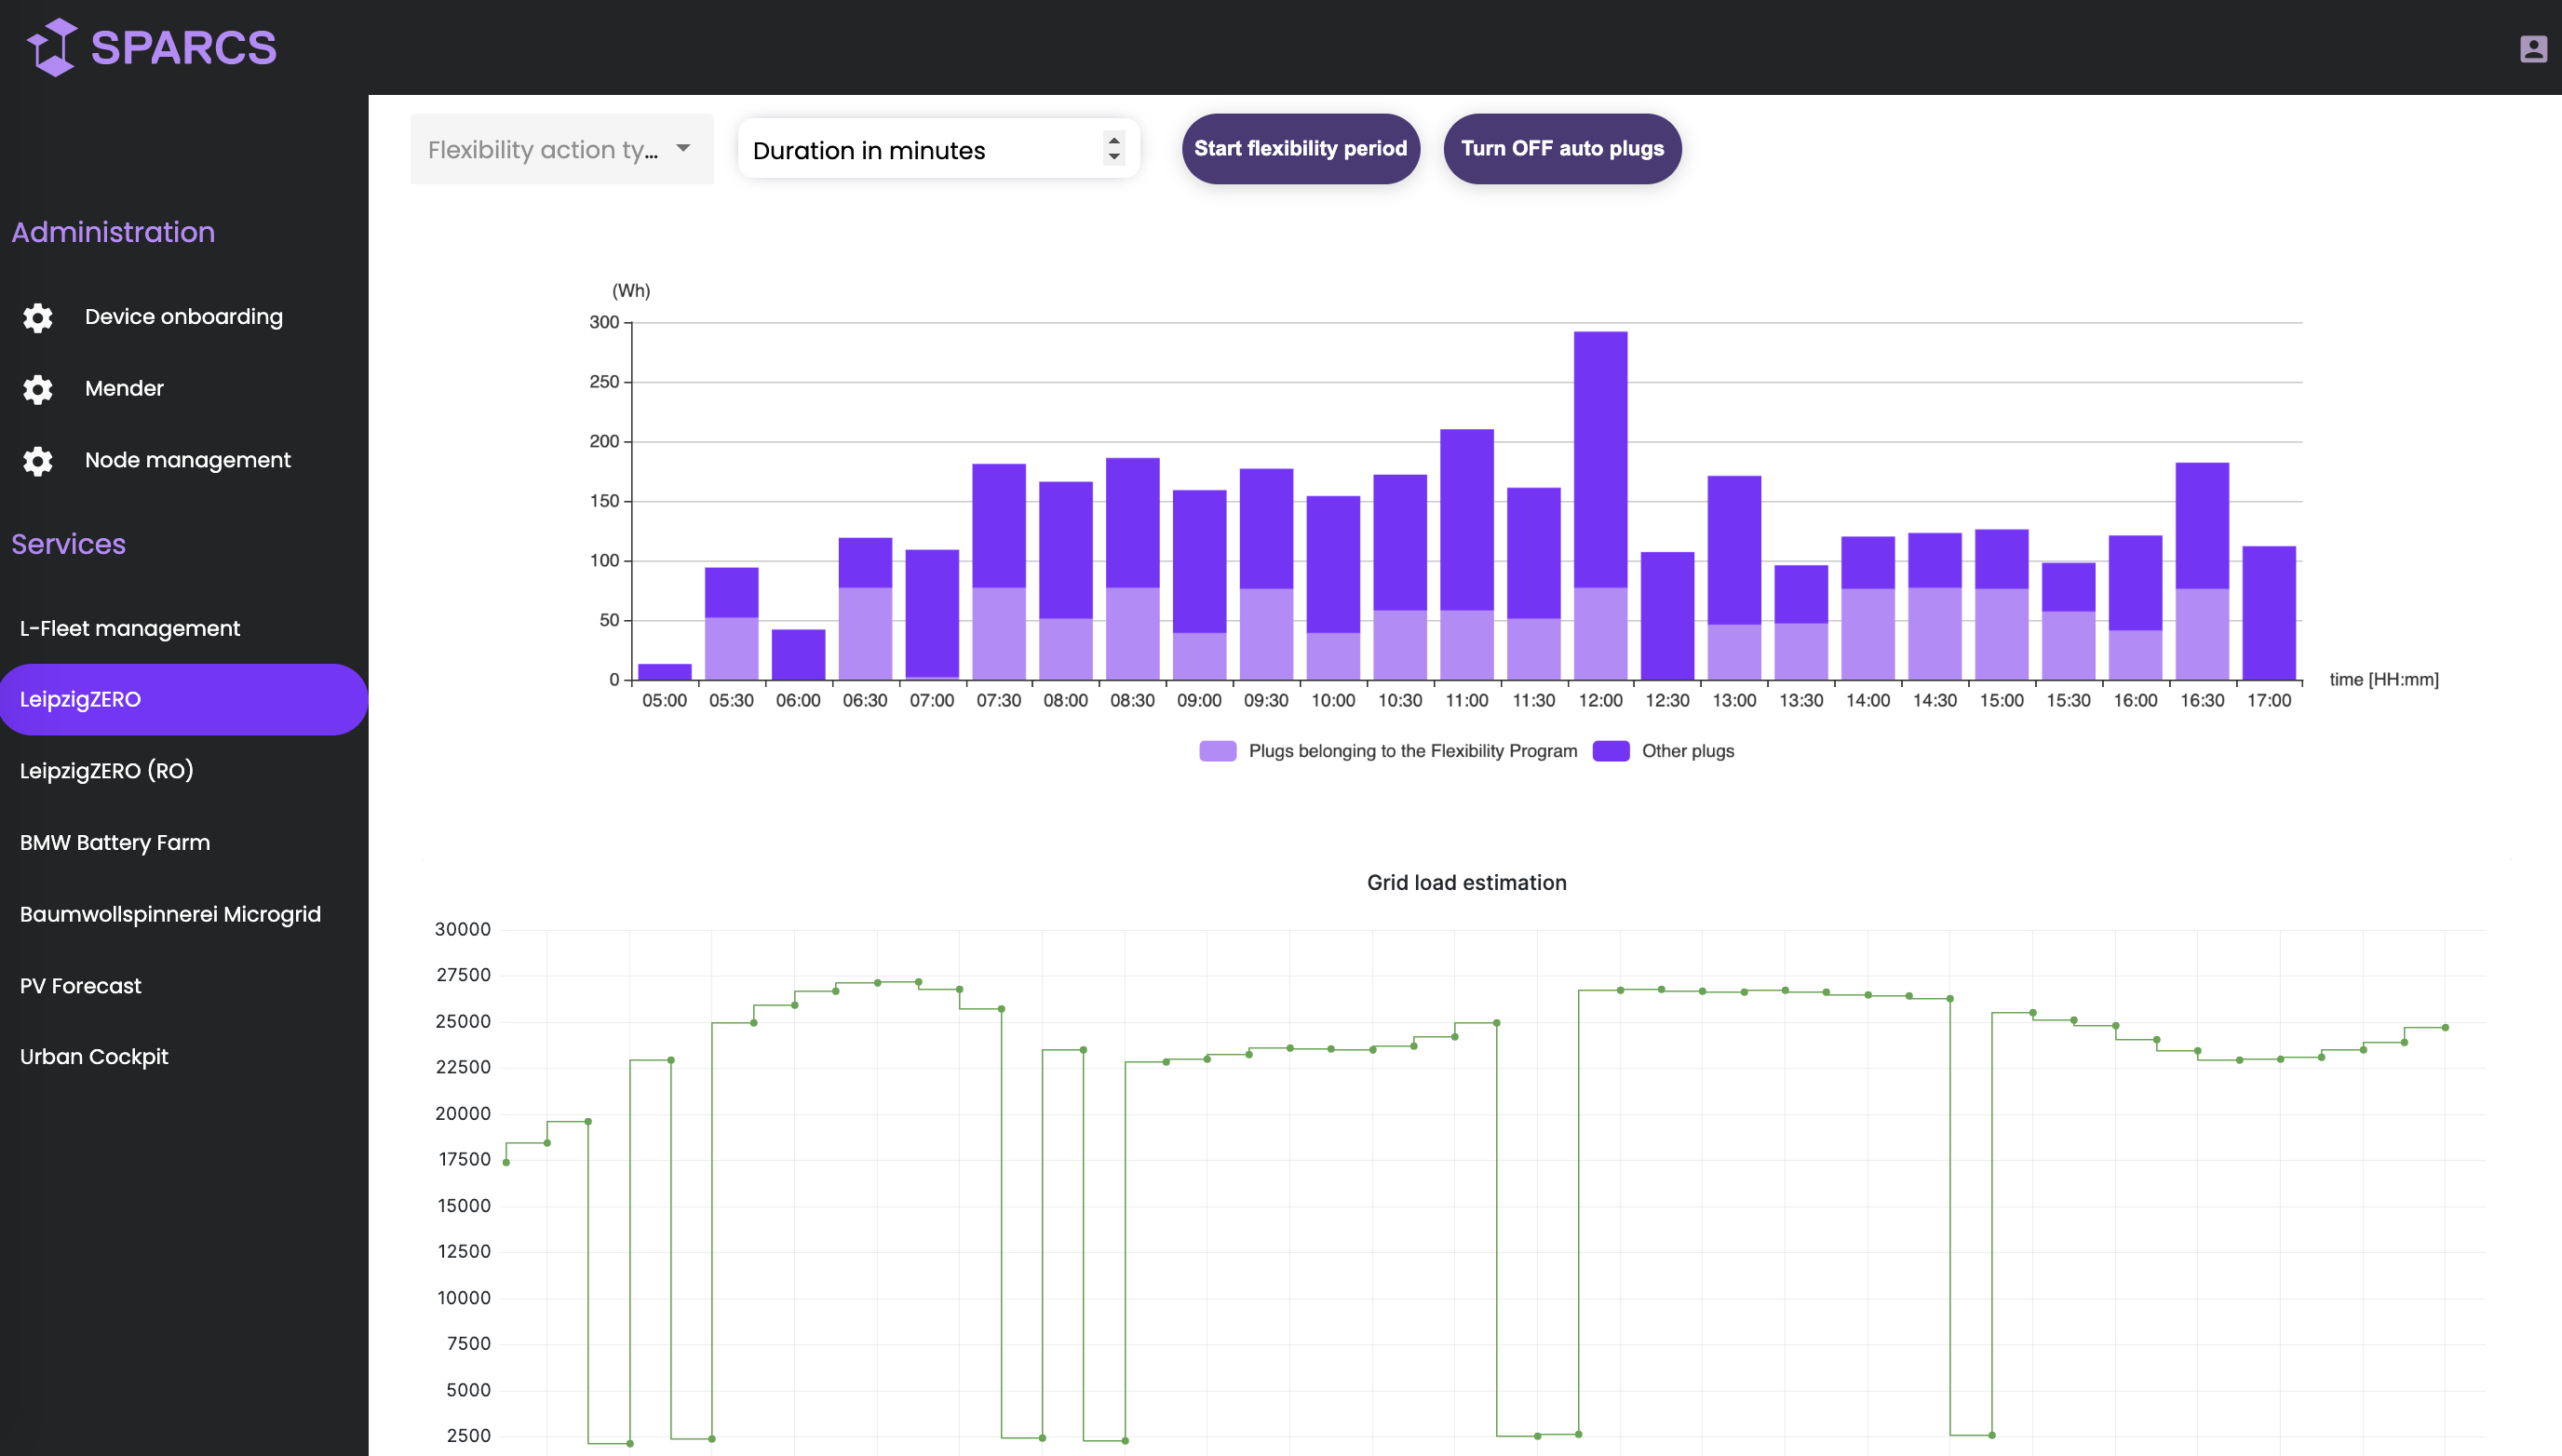
A good example of efficient monitoring and control via dashboard is the internal trial run of the “Smart Socket” project, the first part of the multi-stage LeipzigZERO programme, with which Leipziger Stadtwerke wants to work together with tenants to develop a forward-thinking awareness of energy in the long term. The dashboard uses a column chart to visualise the current power consumption of the connected smart plugs, which is continuously recorded. At the same time, the current utilisation of the power grids is also shown. Together, these data provide a good orientation aid because they show when it makes sense to switch off smart plugs. This can then be initiated from the dashboard: either directly or by means of an instruction to the user via a push message.
Showcases also take place in the dashboard to test future business models. This simulates real-time energy trading with the cotton mill and integration of the BMW storage farm into the virtual power plant as a live laboratory. This allows the integration and exchange of energy volumes to be tested in real-time, even if the current regulation does not yet provide the appropriate market instruments.
This is one of the core benefits of the dashboard: by testing products and applications with its help, one can, at the same time, test how the digitization of the energy transition can be designed. The visualisations make content and measurement values visible and thus facilitate access to and understanding of the corresponding projects for non-technicians. The same applies to other project partners and other interested parties. Last but not least, projects can be linked to other levels of usage outside the technical context, such as the business level, via the dashboard.
The dashboard development took about six months, but the design is not yet final. Currently, only employees of Leipziger Stadtwerke have access – internal project partners are to follow so that the dashboard will accompany the entire monitoring phase of the SPARCS projects until September 2024 as their digital representation.